Comprehensive Financial Insights

Instantly visualize your profitability with a detailed overview of your financial standing.

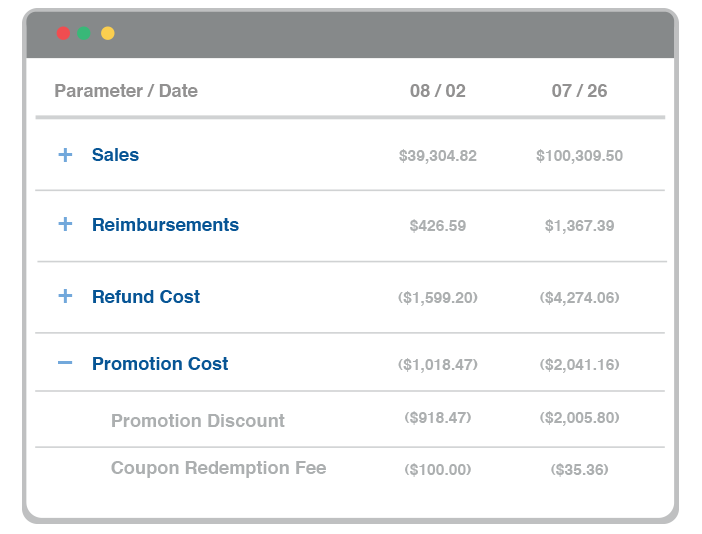
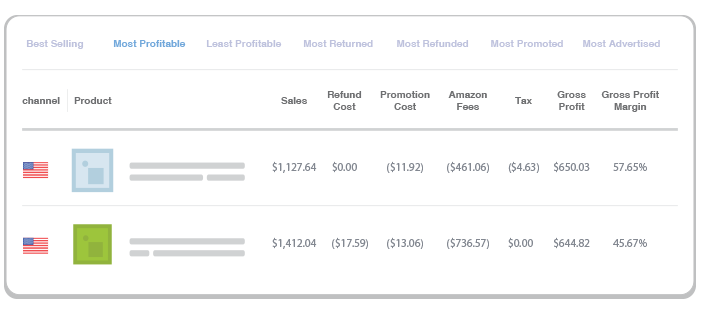
Accurate and complete data are critical in providing sellers with actionable financial data. With BQool's BigCentral Profit Dashboard, sellers now have access to relevant Amazon sales and fees, providing them with a clear picture of their current business performance. And BQool further provides granular data, breaking down key fees and costs, such as Refund Costs, Promotion Costs, Advertising Costs, and much more, enabling sellers to see a clear picture of their business.

Simple Profit and Loss Statement.
Detailed cost and fee breakdown, including Restocking fee, FBA Per Unit Fulfillment Fee, Marketplace Facilitator Tax, etc.
Detailed Reimbursement breakdown: Warehouse Damage, Lost, Missed From Inbound, etc.

Trends and Comparisons

Easily compare current and historical performances to uncover hidden trends and forecast future activities.

Understanding, evaluating, and benchmarking your financial performance requires complete data from both the current and historical periods. BQool has consolidated years of data points to provide sellers with comparative sales and cost data, to quickly identify and analyze key changes over a selected timeframe, enabling sellers to execute the appropriate solutions. And with the custom date ranges, sellers can quickly analyze the results of their campaigns.

Compare your financial data by Day, Week, or Month.
Easily Identify Trends with Intuitive Graphs.

Product Level ROI Performance

Effortlessly identify a product's profit margin, sales, and costs, all at a glance.

With multiple listings, identifying and keeping track of each profitable product can be cumbersome or downright difficult, especially with the multitude of Amazon-related fees. However, with BQool's Profit Dashboard, sellers may conveniently view product-related sales, cost, profit, and margins, all in a single pane. And to further simplify this task, there are a set of performance ranking lists, empowering sellers to better understand the top products and where to allocate their resources.

Easy-to-view product cost breakdown and profitability.
Downloadable Product Performance Report.
Multiple performance rankings: Most Profitable, Most Refunded, Most Advertised, Most Reimbursed, etc.

Daily Profit

Conveniently view a daily summary of the overall business operations.

Multiple Currencies

Supports multiple currencies including USD, CAD, CNY, EUR, GBP, JPY, and MXN.

Filterable by Account or Channel

Quickly uncover your profitability and detailed financials by account or channel.

Data-Driven Insights Powering Your Amazon Business.

Comprehensive financial analytics, trends, and comparisons, to drive smarter business decisions.